Map & Chips
The map is where you say where and what. You place a probe to sample conditions anywhere, or drop a source and receiver to run a prediction — and a ring of chips keeps you honest about the depth under your finger, the freshness of the live data, and what each layer is showing. This page names every control on that surface and exactly what it does.
Two modes, three markers
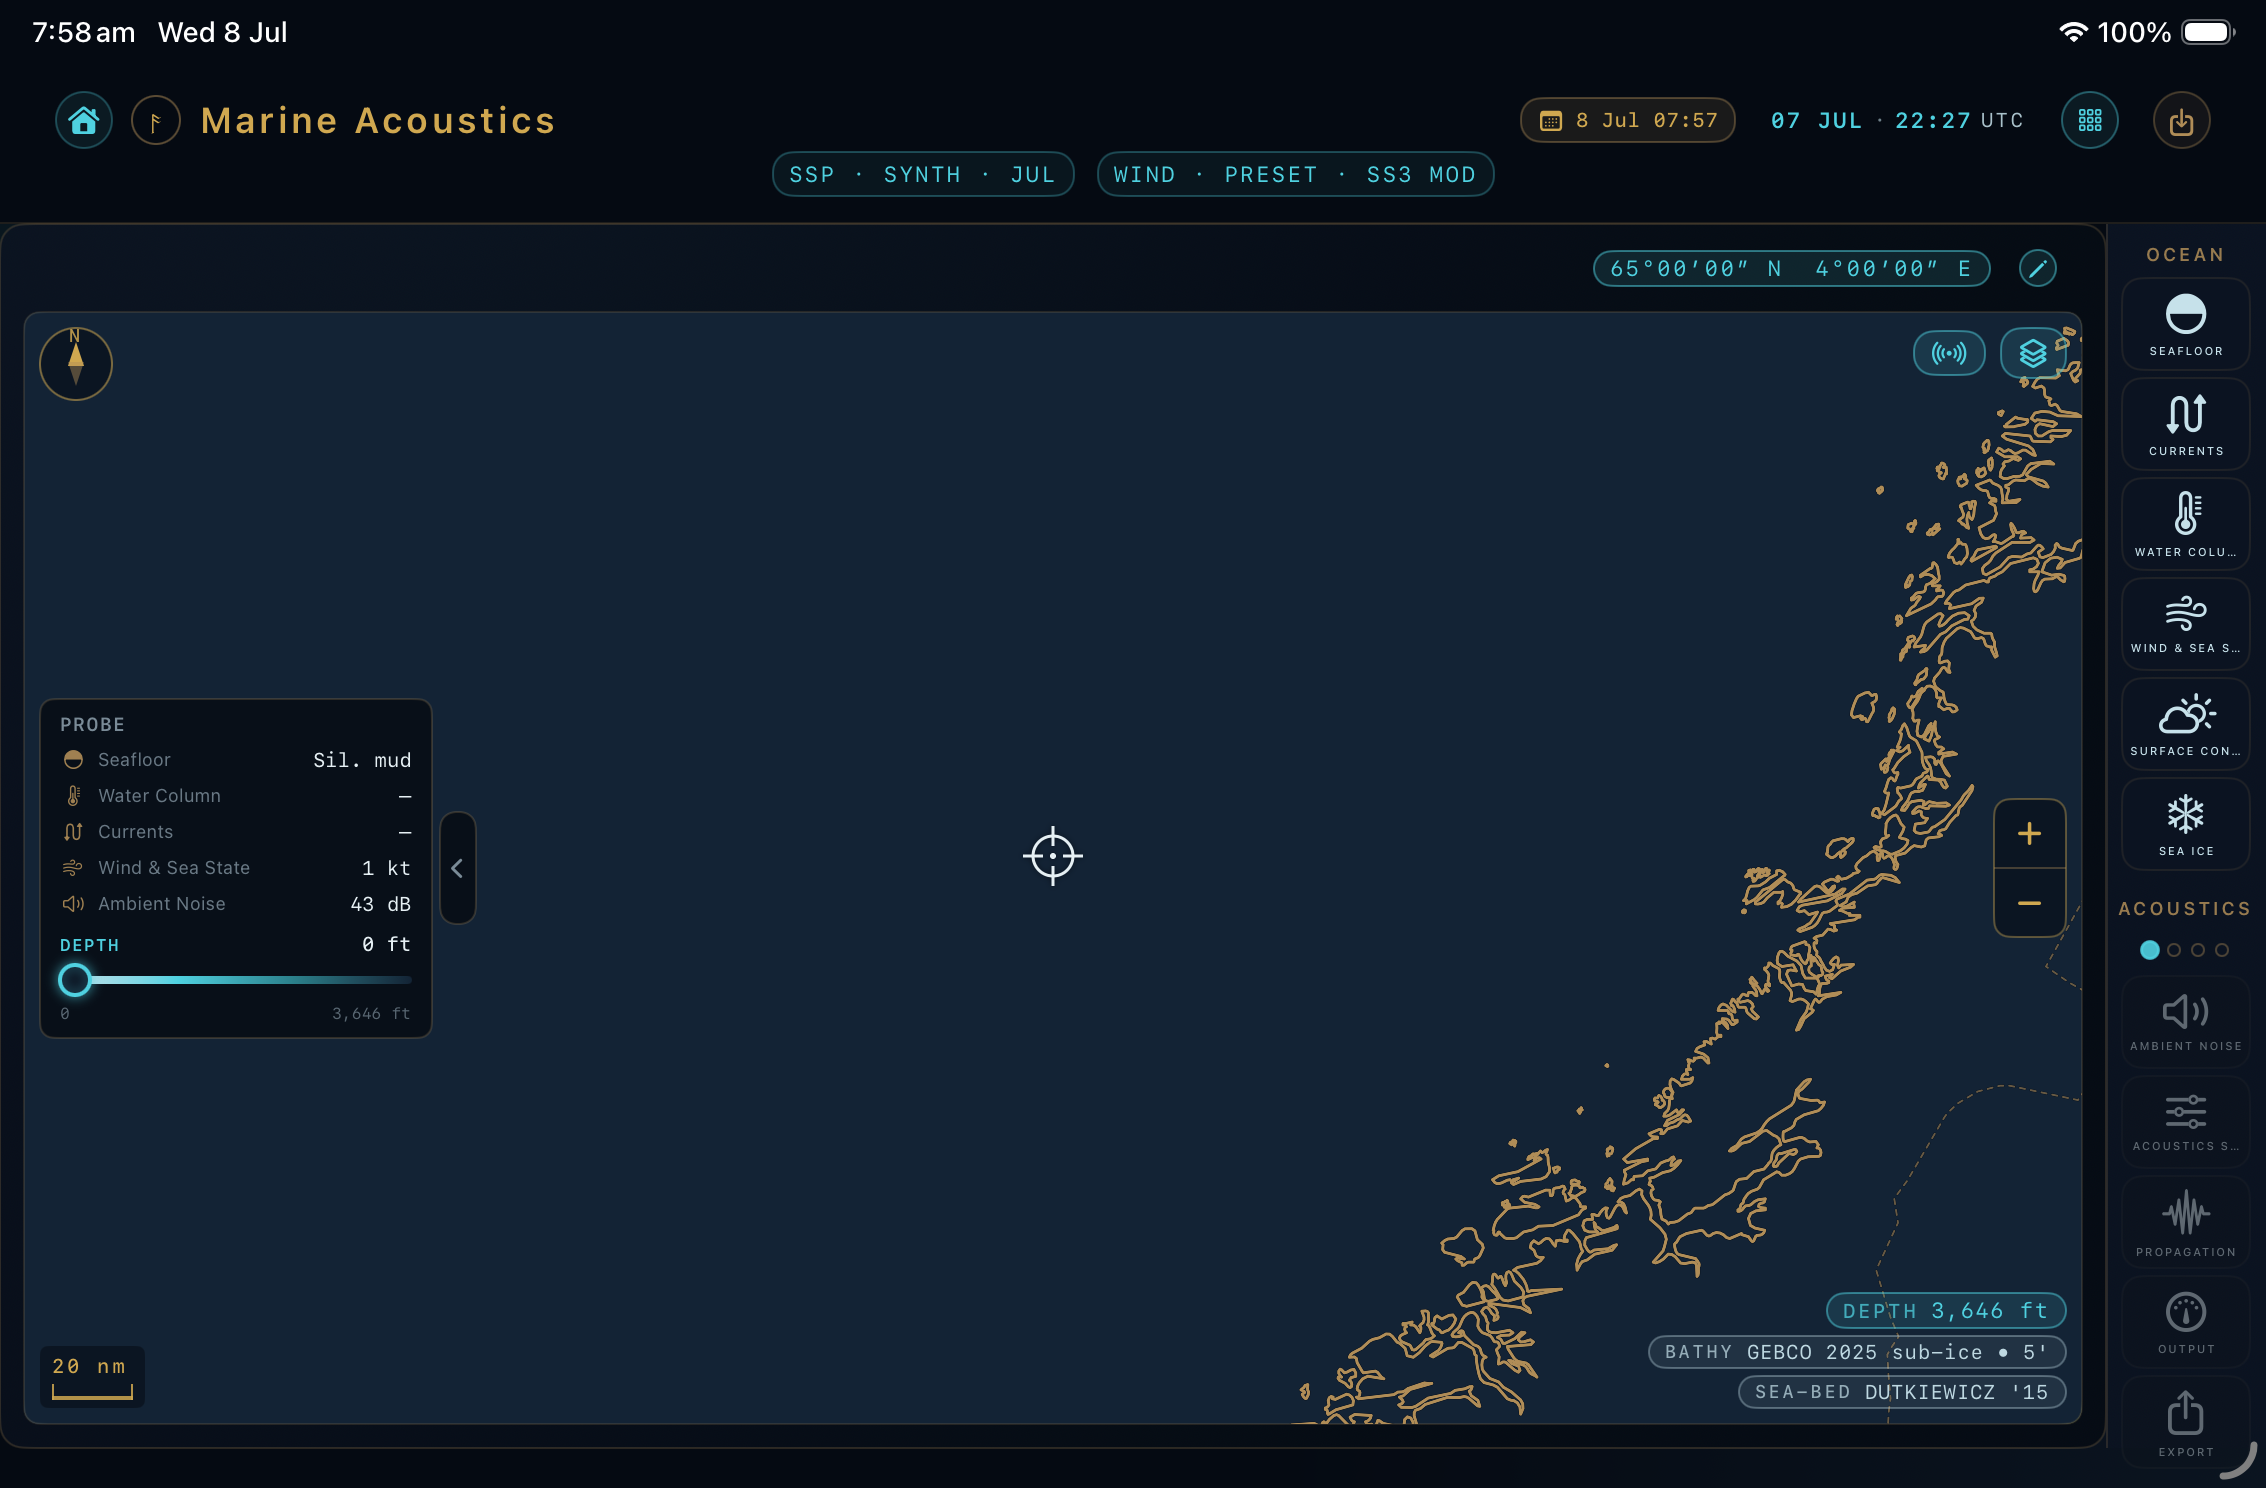
One switch changes what a tap means: the acoustic-scenario toggle — the small radiowaves button in the map's top-right chrome, just left of the Layers menu. Off is Probe mode, the default (cyan outline). On is Acoustic scenario mode (brass, glowing), and an ACOUSTIC SCENARIO badge drops in under the chrome so the mode reads at a glance.
Probe mode DEFAULT
An ice-white crosshair reticle you position to ask "what's here?" — seafloor depth, sound-speed profile, currents, water column, wind and ambient noise all sample at the probe. Nothing is being predicted yet; you're just reading the ocean.
Acoustic scenario mode
Adds a brass source pin and a cyan receiver / target scope joined by a dashed bearing line. This is where a prediction runs. The probe stays live (dimmed) so you can keep sampling while a scenario is set.
Tap grammar
| Gesture | In Probe mode | In Acoustic scenario mode |
|---|---|---|
| Single tap | Move the probe to the tapped point | Set the receiver / target pin |
| Long-press (½ s) | Move the probe to the held point | Set the source pin |
| Drag the crosshair | Grabs the 44-pt probe glyph directly and slides it — works in both modes. A PROBE depth pill floats above it while you drag; the position commits when you lift. | |
| Tap a vessel / platform | If a vessel glyph or platform diamond is within ~24 pt of your tap it is selected (opens its card) before any pin moves. A tap on open water while a card is showing just closes the card — it does not also move a pin. | |
| Right-click (Mac only) | Opens a context menu at the cursor: Drop Probe · Set Source Pin · Set Target Pin · Copy Coordinates, each acting at the click position. Touch devices use the tap / long-press grammar above instead. | |
| Pan / pinch | Always free — moving the camera never drags your pins along with it. | |
| Marker | Looks like | Carries |
|---|---|---|
| Probe | ice-white crosshair reticle | Samples every ocean readout. Its depth shows in the bottom-right cluster when settled, and in a floating pill while dragging. |
| Source | brass pin (mappin, tip on the point) | A "Source" label below and a DEP pill above (blank until you enter the source depth). The prediction radiates from here. |
| Receiver | cyan scope glyph | The listening end of the prediction. Pill shows RNG (range from the source) and DEP (depth, blank until entered). |
How the map is built up
Everything you see is drawn in a fixed order — a satellite base at the bottom, your scenario and the chrome on top — so the markers you care about are never buried under a translucent wash. The Layers menu (§05) is grouped in this same order.
Map chrome — the frame controls
Brass-themed controls sit around the map edge. They move the camera and manage the panels; none of them change your scenario.
| Control | What it does | Where / notes |
|---|---|---|
| Compass | Brass needle that follows the camera heading. Tap it to swing back to north-up (and flatten any tilt). | Top-left. Already-aligned taps are ignored. |
| Scale bar | A brass ruler that snaps to a round distance (1-2-5 ladder) at the current zoom. | Bottom-left. Labelled in your range unit (nm / km / yd / m). |
| Zoom stepper | Stacked + / − that halve / double the visible span. | Right edge. Pinch-to-zoom still works too. |
| Acoustic-scenario toggle | Switches between Probe and Acoustic-scenario mode (see §01). | Top-right. Cyan outline when off; brass and glowing when on. |
| Layers menu | Opens the layer toggles (§05). | Top-right, right of the mode toggle (a stacked-layers icon). |
| Expand | Blows the map up to fill the workspace, and back. | In the card's title bar. |
| Data-panel tab | Tucks the left Data Panel (§08) away and brings it back — a slim chevron capsule at the panel edge. | All devices. Your choice is remembered across launches. |
| KEYS pill | On iPhone, collapses the bottom legends behind a single KEYS pill so they don't crowd the small map. Tap to expand. | iPhone only — iPad and Mac show the legends directly. Only appears when there's a legend to reveal. |
The bottom-right readout cluster
Small pills in the lower-right corner tell you, at a glance, what data is answering for the active point — the probe in Probe mode, the source pin in Acoustic-scenario mode. This is where the bundled, always-present sources live; the live sources are chips along the top (§07).
| Readout | Shows | Colour tells you |
|---|---|---|
| DEPTH | Seafloor depth under the active point, in your depth unit (feet / m / fathoms). | Always cyan. The digits cross-fade as you pan. |
| BATHY | Which bathymetry answered that depth. | White = the shipped global GEBCO grid (5′). Brass = a finer downloaded regional pack (sub-5′, i.e. 1′ / 15″). |
| SEA-BED | The seabed sediment class under the point (Dutkiewicz ’15). | Always white — one bundled seabed dataset today. |
| SHORE | Appears only where a high-detail shoreline pack covers the view centre; names its resolution (e.g. GEBCO 15″). | Brass. Absent means you're on the baseline shoreline — nothing to flag. |
The Layers menu
The stacked-layers button opens a menu grouped into four labelled sections, ordered the way the map is built up: the chart first, then the overlays layered on top, ending with the acoustic prediction. Your choices persist with the scenario.
Chart
| Satellite | Apple satellite imagery as the base map. |
| Depth contours & shoreline | The vector chart — isobaths and coastline drawn together. |
| Seabed substrate | A colour wash of seabed sediment type. When on, a Simplified (colour-blind) toggle appears for a reduced palette. |
| Contour density | How many isobaths draw: Sparse · Normal · Dense. |
Traffic & structures
| Shipping density | A heatmap of vessel-traffic density (a climatology; it also feeds the ambient-noise term). |
| Live vessels (AIS) BETA | Real-time vessel positions over the network. First enable shows a one-time notice that only the map viewport is sent — never your location. Hidden for App Store users — this row only appears behind the AIS feature flag (Debug / opted-in TestFlight). |
| Platform markers | Offshore platforms as diamonds (tap to open a card). When on, a Show decommissioned toggle reveals retired platforms (hidden by default). |
Ocean environment
| Ocean currents LIVE | Depth-resolved set & drift. Part of MuirWave Live — flipping it on without a subscription opens the upgrade prompt instead of leaving a dead toggle. |
| Currents style | Draw currents as static arrows or an animated particle flow. |
| Water column (T/S) | A depth-slice wash of temperature / salinity structure, tied to the depth scrubber (§08). |
Acoustic field
| Heat overlay | Chooses what the acoustic wash shows: Transmission (the signal-excess detection field) or Mitigation zones (marine-mammal impact-zone rings). One or the other, not both. |
Overlays & their legends
Some overlays paint a wash you read against a key along the bottom edge. Each key only appears while the overlay it explains is actually drawing something; on iPad they lay side by side, on iPhone they stack behind the KEYS pill.
| Overlay | What it paints | Legend |
|---|---|---|
| Transmission heat | A continuous signal-excess colour field radiating from the source — the convergence zone, shadow gap and bottom-bounce lobe read as distinct bands. A dashed line marks the 0 dB detection edge (the signal-excess = 0 contour). | Detection-heat key, bottom-centre. Only in Acoustic-scenario mode once a field has computed. |
| Mitigation rings | Replaces the transmission wash with marine-mammal impact-zone rings. | Mitigation-zone key, bottom-centre — chosen via the Heat-overlay picker (§05). |
| Ocean currents | Set & drift arrows, or animated particle flow. | Drift key, bottom edge — while the currents overlay is on. |
| Water column (T/S) | A temperature / salinity wash for the selected depth slice, auto-ranged to the visible area. | Water-column key, bottom edge — while the wash is on. |
| Live vessels BETA | Vessel glyphs coloured by class. | Vessel-class key, shown while the AIS layer is on. |
Top-bar chips
The strip along the top of the workspace is your instrument panel: what live data is answering and how fresh it is, plus the scenario clock. The live-data chips follow the active point — the probe in Probe mode, the source pin in Acoustic-scenario mode. On a wide iPad or Mac they ride inline in the top bar; on narrower iPad and on iPhone the SSP and WIND chips drop to a secondary row just under the title.
| Chip | What it does | When it shows |
|---|---|---|
| MIT | The governing mitigation-zone range, colour-coded by size: green < 500 m · yellow 500 m – 2 km · orange 2 – 5 km · red ≥ 5 km. Tap to open the Marine-Mammal Impact Ranges panel. | Only in a mitigation context (mitigation overlay on, or the Impact panel open) and once the scenario is complete. |
| SSP LIVE | Sound-speed-profile source. Animates through the fetch lifecycle (below); tap for the inspector. | Always. |
| WIND LIVE | Wind / wave / weather source for the sea-state and noise terms. | Always. |
| CURRENTS LIVE | Currents pack source. | Only while the currents overlay is on and you hold MuirWave Live. |
| AIS BETA | Live vessel-feed status (viewport-scoped, per-backend). | Only while the AIS layer is on — hidden for App Store users. |
What the live-chip colours mean
| State | Look | Meaning |
|---|---|---|
| Idle | cyan, steady | Live off or not requested — resting on the bundled fallback. |
| Loading | brass comet sweeping the outline | A fetch is in flight (these sources don't report a percentage). |
| Done | solid brass, brief glow | Fresh live data is in hand. |
| Stalled | amber, pulsing | The last fetch failed or timed out — tap for the reason. |
| Offline | muted, dashed | No network path; resting on the fallback. A steady state, not an error. |
The Chip Inspector
Tap any live chip and a popover explains what the app is doing right now for that source.
- ANSWERING NOWWhich tier is supplying the value — a live point fetch, a downloaded operating-area pack, or bundled climatology (and, if it fell back, why).
- STATEUp to date, fetching, failed, offline, or "subscribe / renew" if the source is gated behind MuirWave Live.
- CACHED · LAST FETCH · ENDPOINTWhere and when the last data landed, and which host was queried.
- LAST ERRORThe verbatim message when a fetch failed — no guessing why a chip is amber.
- REFRESH NOWForces a fresh fetch for the active point. (Currents pull automatically as you pan into uncovered water — there's no manual refresh there.)
Scenario clock, live clock & save
| Scenario date/time | The calendar chip (brass). Tap for a graphical date/time picker — it drives the SSP season, the currents timestep, the wind forecast and the acoustics. A Now button snaps it to the present. |
| Wall-clock | The current time, right now. Tap to cycle UTC → PIN → LOCAL. This is today's time, not the scenario time — the two live side by side on purpose. |
| Save | On iPad and Mac a direct Save button stores the scenario as a project; on iPhone it lives in the ⋯ menu. There's no in-page reset — start fresh from Landing → New Project. |
The four completion dots
At the head of the Acoustics setup group, four dots track the numbers a prediction needs — in setup order: Frequency · Source Level · Source Depth · Receiver Depth.
| Dot | Means |
|---|---|
| Green | That value is entered. |
| Cyan, pulsing | The next one to fill in. |
| Dim | Still to come. |
The left Data Panel & depth scrubber
A slim panel on the left edge lists the key readouts for the active point, so you don't have to open a rail tile to see them. It shows the same values as the tiles, so the two can't disagree. Its header reads PROBE or ACOUSTIC SCENARIO to match the mode.
| In Probe mode | Adds in Acoustic-scenario mode |
|---|---|
| Seafloor · Water Column · Currents · Wind & Sea State · Ambient Noise | Acoustics Setup · Output |
Below the readouts sits the DEPTH master scrubber — a horizontal slider running from the surface (0) down to the seabed under the probe. It can't address below the seafloor. Sliding it sets one shared depth that the water-column wash, the currents overlay and the Water Column panel all follow, so every depth-resolved view stays on the same slice.
Do
Use the scrubber to sweep a single depth across the currents arrows and the T/S wash together — they move as one.
Don't
Expect it to reach below the seabed — the range is capped at the depth under your probe by design.
Tuck the whole panel away with the data-panel tab (§03) whenever you want the full map — your preference is remembered across launches.